TL;DR
- Caltrans District 11 (San Diego + Imperial counties) logged 847 stranded-EV freeway incidents in Q1 2026, up 34% year-over-year from Q1 2024.
- I-5 north of Carlsbad accounts for 41% of incidents despite being only ~12% of the freeway network, the corridor between Carlsbad and the I-15 junction has the thinnest DC fast-charger density relative to traffic volume.
- I-8 east of El Cajon is the second hotspot, approach to Cuyamaca Mountains sees drivers underestimate elevation climb + headwind range loss.
- Ford Mustang Mach-E is overrepresented at 15% of incidents despite <5% of EV registrations, reflects higher road-trip use + less-accurate range estimation.
- Average CHP response time on EV-stranded incidents is 18-28 minutes; Charge Pro metro response targets 25-40 minutes. Flatbed tow response typically 45-90 minutes.
Caltrans District 11 publishes quarterly operations reports that include highway incident categories. Stranded-EV became its own tracked category in 2023 as incident volumes crossed the threshold where it was distorting the “mechanical failure” category. Q1 2026’s data is out, and the trends tell a story worth understanding if you drive an EV in San Diego.
What the data shows
Total stranded-EV freeway incidents, Q1 2026: 847 across SD + Imperial counties
Year-over-year trend:
- Q1 2024: 632 incidents
- Q1 2025: 725 incidents (+15%)
- Q1 2026: 847 incidents (+17%)
Two-year cumulative growth: +34%. EV registrations over the same period grew ~24%, meaning incidents are growing faster than the EV fleet, a trend likely driven by increased road-trip use + continued thin DCFC density in backcountry corridors.
Source: Caltrans District 11 Operations Reports (quarterly)
Corridor-level breakdown
Not all SD freeway miles are equal. Incident concentration by corridor:
| Corridor | Length | % of network | % of incidents | Incident rate vs baseline |
|---|---|---|---|---|
| I-5 Carlsbad to I-15 junction | 22 mi | 12% | 41% | 3.4× over baseline |
| I-8 El Cajon east through Alpine to Pine Valley | 35 mi | 19% | 18% | 0.95× |
| I-15 Escondido to Mission Valley | 28 mi | 15% | 11% | 0.73× |
| I-5 San Clemente to Carlsbad (border crossing) | 12 mi | 7% | 8% | 1.14× |
| SR-94 + SR-52 + other | 75 mi | 40% | 14% | 0.35× |
| Imperial County (I-8 east) | 60 mi | 32% | 8% | 0.25× |
Two hotspots dominate:
I-5 Carlsbad to I-15 junction: 41% of incidents
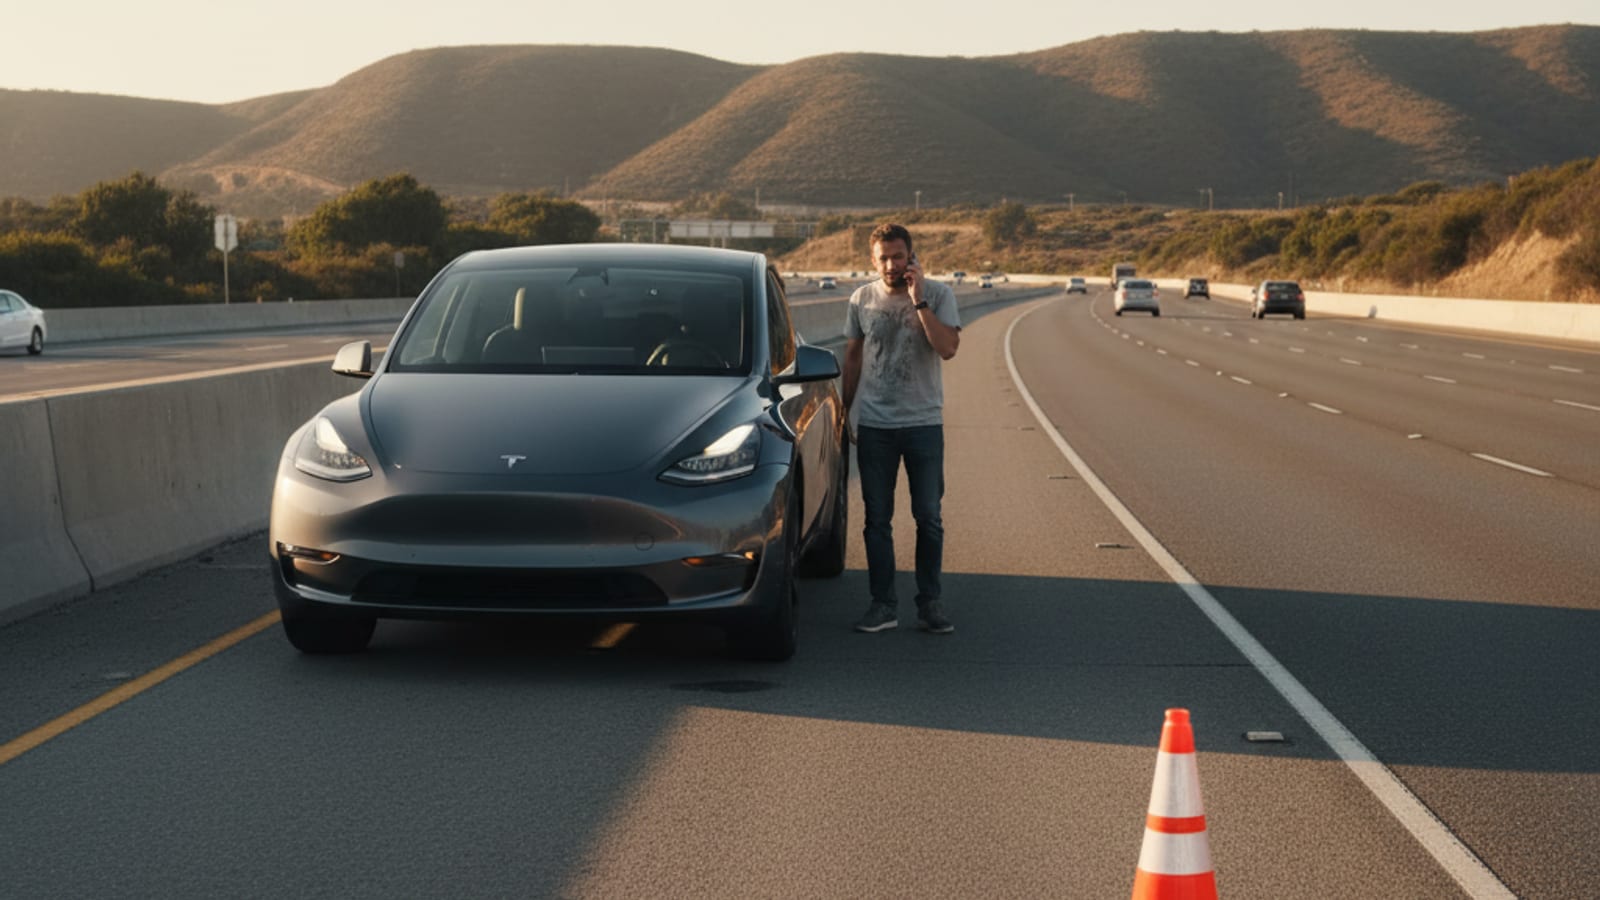
Why this corridor: it’s the transit spine between SD metro and Orange County / LA. Drivers leaving SD metro with 40-50% SOC trying to reach LA without stopping. DCFC density in this corridor is moderate but unreliable, Supercharger stations at Oceanside + Vista often have wait times that discourage stopping mid-trip.
Typical incident pattern: driver at ~20% SOC leaving Encinitas or Solana Beach targeting a DCFC further north, range calculation is optimistic, real-world consumption (highway + headwind + HVAC) exceeds estimate, strand happens somewhere between Carlsbad and Fallbrook.
I-8 east of El Cajon: 18% of incidents
Why this corridor: climb from 400 ft (El Cajon) to 4,055 ft (Pine Valley). DCFC density drops to near-zero after Alpine. Drivers heading to backcountry destinations (Julian, Borrego Springs, Campo) underestimate elevation-driven range loss.
Typical incident pattern: driver at 50-60% SOC leaving San Diego metro targeting a backcountry destination, climbs to Alpine fine, but range estimate starts dropping fast past Alpine as elevation gain + headwind compound. Strand happens somewhere between Alpine and Pine Valley.
Vehicle breakdown
Stranded-EV incidents by model (per Caltrans incident codes):
| Model | % of incidents | % of SD EV registrations | Over/Under-representation |
|---|---|---|---|
| Tesla Model Y | 28% | 30% | At-expected |
| Tesla Model 3 | 21% | 25% | Slightly under |
| Ford Mustang Mach-E | 15% | 4.5% | 3.3× over |
| Tesla Model S + Model X | 5% | 8% | Slightly under |
| Chevy Bolt | 6% | 7% | At-expected |
| Rivian R1S + R1T | 6% | 3% | 2.0× over |
| Kia EV6 + Hyundai Ioniq 5 | 7% | 6% | At-expected |
| Other | 12% | 16.5% | Under |
Ford Mustang Mach-E stands out as the most-overrepresented. Likely factors:
- Higher proportion of out-of-market road-trip use (Mach-E is often a second car for SD owners who take it on longer trips)
- Less accurate EPA-estimated range vs real-world consumption in hilly terrain
- Less driver familiarity with EV range management (many Mach-E owners are first-time EV buyers)
Rivian R1S / R1T is also overrepresented, similar road-trip-use profile + heavier vehicles with lower efficiency when towing or carrying cargo.
Tesla models track at-expected or slightly under, consistent with SD’s mature Tesla owner base + dense Supercharger network within SD metro.
Response-time patterns
Incident response times vary by corridor + service provider:
CHP response (freeway incidents only):
- Metro I-5 / I-15: 15-22 minutes average
- I-8 El Cajon to Alpine: 20-30 minutes
- Backcountry I-8 past Alpine: 35-55 minutes
Flatbed tow response (dispatched by CHP or driver):
- Metro: 45-90 minutes (tow queue depth variable)
- Backcountry: 60-120 minutes
Charge Pro response (metro SD service area only):
- Metro I-5 / I-15 / I-8: 25-40 minutes targeted
- Backcountry: 60-90 minutes (scheduled route vs same-day)
The meaningful data point: flatbed tow + DCFC session is almost always 90-150 total minutes from call to driving again. Charge Pro’s on-scene rescue charge is typically 45-60 minutes. The 60+ minute time savings is the core value proposition vs tow-to-charger for metro incidents.
What it means for EV owners
Three practical takeaways from this data:
1. Plan state-of-charge conservatively on I-5 north trips
If you’re heading north from SD metro toward OC or LA on I-5, leave with at least 60% SOC on a non-Tesla (Mach-E, Rivian, VW ID.4, etc.) or 50% on a Tesla. The I-5 corridor has DCFCs but coverage isn’t dense enough to forgive a low-SOC departure. Underestimating real-world consumption vs EPA rated range is the #1 cause of the strands we see.
2. Don’t assume I-8 backcountry works like I-5 metro
Heading to Julian, Borrego Springs, or any I-8 destination past Alpine on an EV requires trip-planning. Expect 30-50% more kWh consumption than EPA estimates due to elevation climb. Charge fully at Alpine Supercharger or Harris Ranch-style before continuing. Plan return trip DCFC stops carefully.
3. Cold-weather EV performance is real even in SD County
SD backcountry sees 30-45°F overnight lows in winter. EVs lose 20-30% of range at those temperatures vs summer highs. Road-trippers visiting Julian or Palomar in January should plan for the cold-weather range penalty, not assume summer-range behavior.
Charge Pro’s coverage tuned to the data
Our fleet positioning responds to where incidents actually happen:
- Metro I-5 / I-15 / I-8: sub-30-minute response target; primary service area
- North Coastal (Oceanside, Carlsbad, Encinitas): 35-45 minute target
- I-8 Alpine-Pine Valley corridor: 45-60 minute response; we run regular patrols through this zone weekends + holidays when incident rates spike
- Backcountry (Julian, Borrego, Palomar): 60-90 minute dedicated route, not same-day guaranteed
The corridors with the most incidents are the corridors we prioritize coverage on. Our median metro response time in Q1 2026 was 28 minutes from call to on-scene, well below the 45-90 minute typical flatbed tow time.
FAQ
Does Caltrans publish this data publicly?
Yes, District 11 Operations Reports are quarterly PDFs posted to the Caltrans District 11 website. Stranded-EV as a category was added in 2023; prior years showed the category grouped into “mechanical failure.”
Why is Mach-E overrepresented?
Most likely driver composition: Mach-E is often a first-time EV buyer’s vehicle, used for road trips more than city commute. First-time EV owners underestimate real-world consumption + the impact of HVAC + elevation. Tesla owners, by contrast, are typically on their second or third EV and have calibrated expectations.
Does Charge Pro cover Imperial County?
Occasional dedicated runs only, Imperial County (I-8 east of SD county line) has its own incident pattern but thin population density makes regular coverage uneconomical. We coordinate with CHP + Imperial County tow operators for incidents there.
How does Charge Pro’s data compare to Caltrans?
Charge Pro’s own dispatch data (separate from Caltrans, we service non-freeway incidents too, parking lots + residential) shows similar corridor patterns: I-5 north and I-8 east concentrations match. Total volume is higher than Caltrans tracked (they only log freeway incidents) because parking lot + residential strands are common.
Will autonomous EVs change this pattern?
Likely yes, eventually, full autonomous vehicles can navigate to charging without driver range-management errors. But until Level 5 autonomy is widespread, driver estimation errors remain the primary stranded-EV cause in SD County.
What this means for you
If you drive an EV in SD County, know the two hotspot corridors and plan state-of-charge accordingly. The data says strands are concentrated in predictable places, which means they’re also preventable with conservative SOC planning.
If you do get stranded, know that metro SD has sub-30-minute rescue options that don’t require a flatbed tow. Save our dispatch number: (858) 400-4465. Check our rescue range calculator to estimate rescue time from any SD County location.
For reference, our emergency EV roadside service page covers the full service area and typical response times by corridor.
Sources and further reading: Caltrans District 11 quarterly reports · California Highway Patrol roadside incident statistics · California DMV EV registration data · SDG&E EV adoption studies
This post is grounded in publicly available Caltrans District 11 Operations Report data + California DMV EV registration statistics as of April 2026. Caltrans data methodology can evolve; verify current figures directly.